Frontend observability 
Nais provides frontend observability through the Grafana Faro Web SDK. Faro runs in the browser and instruments your app, shipping telemetry through the platform collector (Alloy) into the shared observability stores: errors and events land in Loki, browser spans in Tempo, and Core Web Vitals in Mimir. You then view and triage it all in Nais APM.
With 95+ applications already using Faro, it's the standard way to monitor frontend applications on Nais.
Recommended: instrument with `@nais/apm`
The recommended way to add Faro to a browser app is the
@nais/apm SDK — a thin Faro wrapper
with zero-config init(), mandatory PII scrubbing, a required
namespace, and a fixed console instrumentation that keeps real stack
traces. It's the instrument half of Nais APM: add @nais/apm, then
view and triage the results on the APM Frontend
and Issues tabs.
Start with Track frontend errors with @nais/apm.
Reach for raw Faro (the guides below) only when you need the lower-level SDK
directly — everything the platform recommends, including
trace propagation
(init({ tracing: true })), is available through @nais/apm.
What you get 
- Core Web Vitals — TTFB, FCP, CLS, LCP, INP (collected automatically)
- Logging —
console.info,console.warn, andconsole.errormessages - Exceptions — stack traces with automatic sourcemap deobfuscation
- Custom events and metrics — anything you want to track
- Tracing — OpenTelemetry-based browser traces, optionally connected to backend spans
Get started 
- Recommended — errors as issues in APM: 🎯 Track frontend errors with
@nais/apm - Next.js (App Router or Pages Router): Next.js quickstart with
@nais/apm - React SPA + Vite: React + Vite quickstart with
@nais/apm - Coming from Sentry? Migrate from Sentry to
@nais/apm - Need the lower-level SDK directly? Set up Faro · Next.js with raw Faro
- Want end-to-end traces? Connect frontend to backend
- Stack traces look minified? Sourcemaps · Troubleshooting
Recommended configuration 
After the basic setup, check that you have these configured:
| Setting | Why it matters | Guide |
|---|---|---|
beforeSend PII filtering | Faro captures URLs and console output that may contain fødselsnummer or tokens | Privacy and sensitive data |
propagateTraceHeaderCorsUrls | Without this, browser traces never connect to your backend spans | Trace propagation |
paused on localhost | Prevents local development noise from polluting production dashboards | Local development |
app.version | Lets you filter errors and metrics by deploy | Setting app.version |
| Error boundary | Catches React rendering errors that are otherwise silently lost | React error boundaries |
Collector endpoints 
The collector URL tells Faro where to send telemetry data. If you use the auto-configuration in nais.yaml, this is set for you.
| Collector endpoint | Environment |
|---|---|
https://telemetry.nav.no/collect | prod |
https://telemetry.ekstern.dev.nav.no/collect | dev |
On-premises clusters are not supported.
Inspecting frontend data in Grafana 
Find your app in the Nais APM service inventory and open it. Browser telemetry surfaces on two tabs:
- Frontend — Core Web Vitals, pageloads, sessions, per-page performance, browser breakdown, and web-vitals attribution (what's driving LCP, INP, and CLS).
- Issues — browser exceptions grouped into issues, side by side with backend errors. Filter the source to Browser to isolate frontend errors, then open an issue for its stack trace and impact.
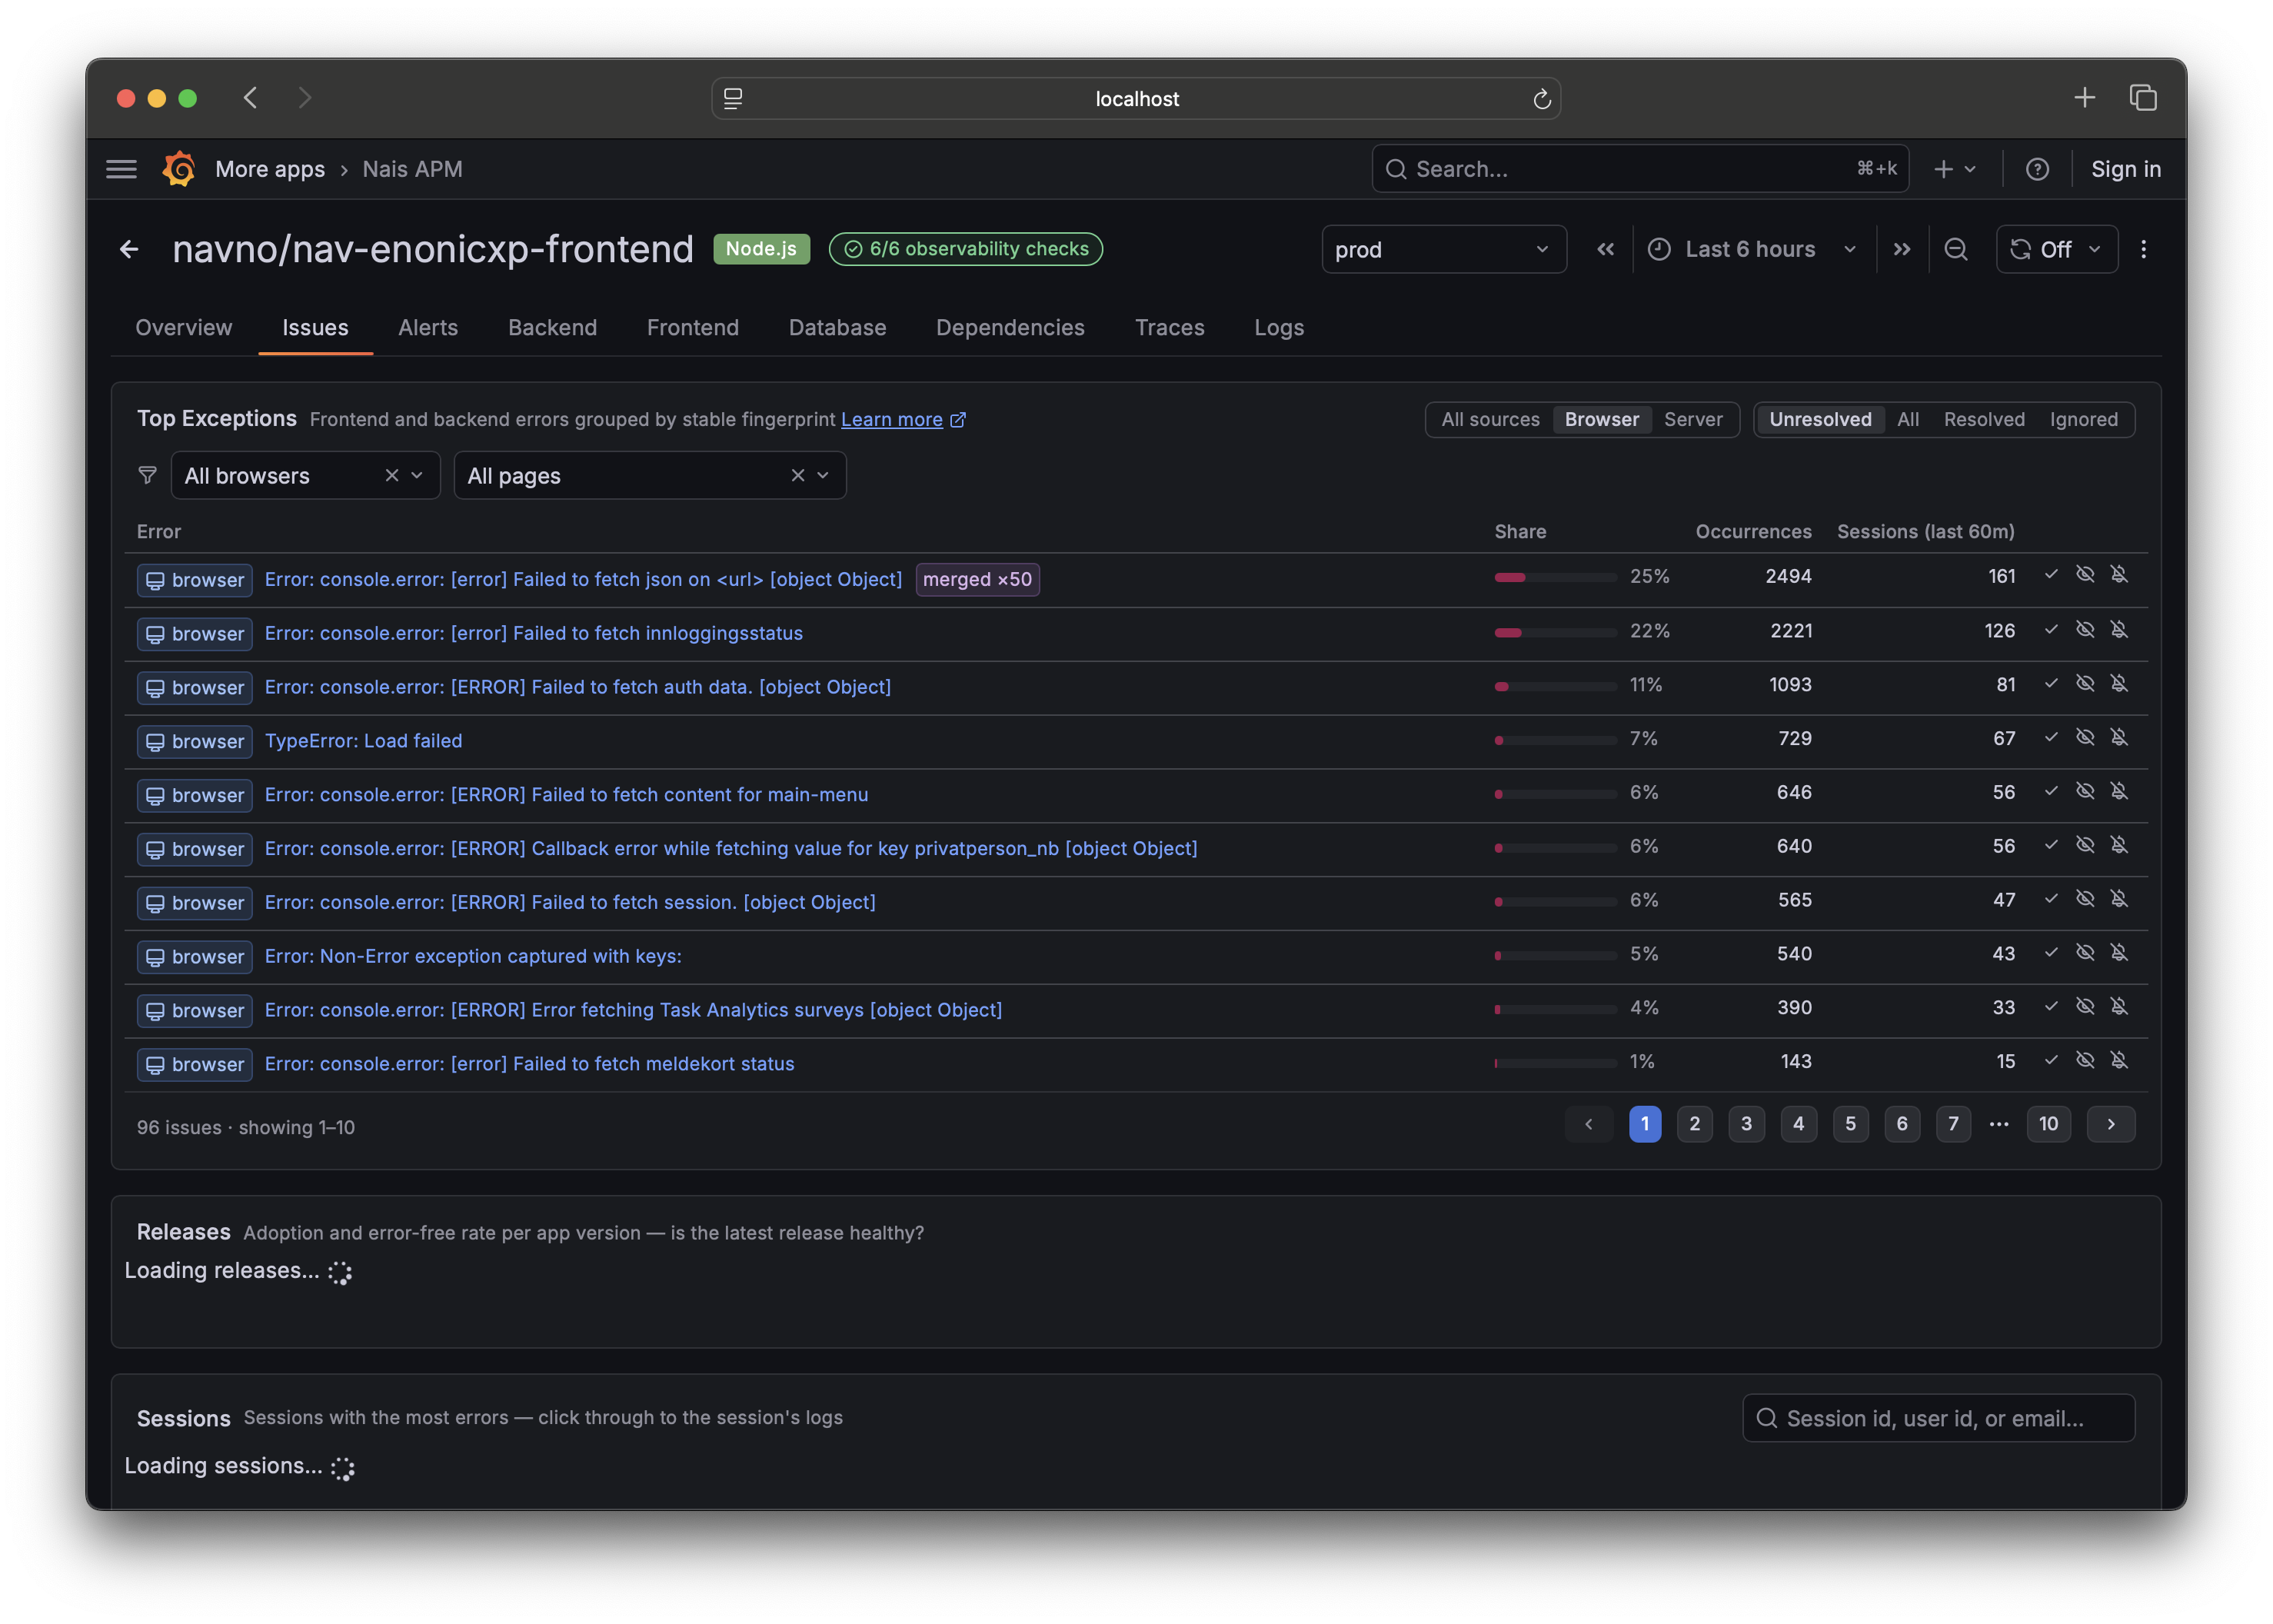
For a full tour of the tabs, see Get started with Nais APM; for capturing errors from your own code, see Track frontend errors with @nais/apm.
For deeper analysis, use the Explore view with one of the Loki data sources. Here are some useful queries:
# All frontend logs for your app
{app_name="my-app"} | logfmt

# Exceptions only
{app_name="my-app", kind="exception"} | logfmt

# Slow Largest Contentful Paint (> 2.5s)
{app_name="my-app", kind="measurement"} | logfmt | web_vitals_lcp > 2500
Traces are available from data sources ending with -tempo. Use TraceQL to query them.
Local development 
For local development, check out the tracing demo repository and run docker-compose up. This gives you a local Grafana, Loki, and Tempo stack to test against. See the README in that repository for details.
Guides 
The recommended path is the @nais/apm SDK. Pick the quickstart for your
framework:
| Framework quickstart | Description |
|---|---|
Next.js with @nais/apm | App Router and Pages Router: client init, error boundary, route tracking, tracing |
React + Vite with @nais/apm | React SPA: entry-point init, error boundary, React Router tracking |
| Migrate from Sentry | Move an existing @sentry/* app onto @nais/apm |
The raw-Faro guides below are the lower-level path — reach for them only when you
need to work with the Faro SDK directly. Everything the platform recommends,
including trace propagation, is available through
@nais/apm (init({ tracing: true })).
| Guide | Description |
|---|---|
| Set up Faro | Install, configure, and deploy Faro in any frontend app |
| Next.js App Router | Faro integration for Next.js with App Router |
| Custom metrics | Send custom measurements and query them in Grafana |
| Trace propagation | Connect frontend traces to backend spans |
| Sourcemaps | How stack trace deobfuscation works |
| Auto-configuration | Generated config values and environment variables |
| Troubleshooting | CSP, CORS, and common issues |
Further reading 
- Nais APM — view and triage the telemetry you instrument here
-
@nais/apmAPI reference — the recommended SDK's full API